This is a package of resources that focus on questions and issues associated with data collection, display and interpretation. Questions about how and where data are collected introduce students to ideas about samples and data variability. Using different data representations stimulates discussion about similarities, differences and appropriateness of graphical displays. The package includes online digital graphing resources and a range of printable student worksheets, graphs to interpret and graphing templates.
Australian Curriculum alignment
Data collections
ACMSP068: Identify questions or issues for categorical variables. Identify data sources and plan methods of data collection and recording
Ice cream PDF https://www.scootle.edu.au/ec/viewing/S4363/pdf/my3_18_act_icecream.pdf
ACMSP069: Collect data, organise into categories and create displays using lists, tables, picture graphs and simple column graphs, with and without the use of digital technologies
ACMSP070: Interpret and compare data displays
Different types of graphs
http://www.scootle.edu.au/ec/viewing/S4363/ways_to_display_data/index.html
Blank Bar Graph
http://www.scootle.edu.au/ec/viewing/S4363/pdf/my2_11_act_blankbar.pdf
Blank Column Graph
http://www.scootle.edu.au/ec/viewing/S4363/pdf/my2_11_act_blankcol.pdf
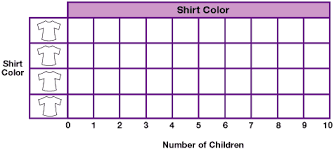
Blank Picture Graph
http://www.scootle.edu.au/ec/viewing/S4363/pdf/my3_18_act_blankpic.pdf
The State of Queensland (Department of Education and Training). (2011). Maths year 3: collect, display and interpret data (Year 3 unit 18 in The learning place). Retrieved May 15, 2015, from http://www.scootle.edu.au/ec/viewing/S4363/index.html
Department Of Education and Training. (n.d.). Graph Maker. Retrieved May 15, 2015, from http://www.scootle.edu.au/ec/viewing/S4363/graph_maker/index.html
Australian Curriculum alignment
Data collections
ACMSP068: Identify questions or issues for categorical variables. Identify data sources and plan methods of data collection and recording
Ice cream PDF https://www.scootle.edu.au/ec/viewing/S4363/pdf/my3_18_act_icecream.pdf
ACMSP069: Collect data, organise into categories and create displays using lists, tables, picture graphs and simple column graphs, with and without the use of digital technologies
ACMSP070: Interpret and compare data displays
Different types of graphs
http://www.scootle.edu.au/ec/viewing/S4363/ways_to_display_data/index.html
Blank Bar Graph
http://www.scootle.edu.au/ec/viewing/S4363/pdf/my2_11_act_blankbar.pdf
Blank Column Graph
http://www.scootle.edu.au/ec/viewing/S4363/pdf/my2_11_act_blankcol.pdf
Blank Picture Graph
http://www.scootle.edu.au/ec/viewing/S4363/pdf/my3_18_act_blankpic.pdf
The State of Queensland (Department of Education and Training). (2011). Maths year 3: collect, display and interpret data (Year 3 unit 18 in The learning place). Retrieved May 15, 2015, from http://www.scootle.edu.au/ec/viewing/S4363/index.html
Department Of Education and Training. (n.d.). Graph Maker. Retrieved May 15, 2015, from http://www.scootle.edu.au/ec/viewing/S4363/graph_maker/index.html
| my2_11_act_blankbar.pdf |
Ms. Martinez's Math Web Page. (n.d.) Bar graphs. Retrieved May 15, 2015, from http://www.vickimartinez.com/math_gc_unit3.html
| my2_11_act_blankcol.pdf |
Houghton Mifflin Company, (n.d.) Math background: Lesson: Graphing Data Developing the Concept. Retrieved May 15, 2015, from http://www.eduplace.com/math/mw/background/1/04/te_1_04_graph_develop.html
| my3_18_act_blankpic.pdf |
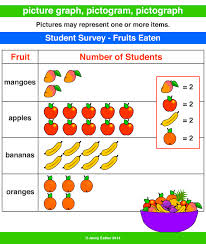
Eather, J. (2014). A maths dictionary for kids: Picture graphs. Retrieved May 15, 2015, from http://www.amathsdictionaryforkids.com/qr/p/pictureGraph.html
